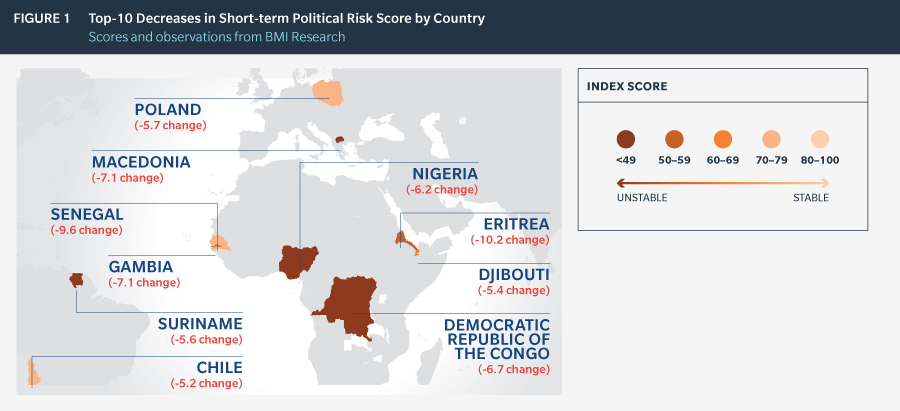
Key Increases and Decreases in Political Risk Since Early 2017
BMI Research’s risk index scores from the past six months indicate that some of the largest improvements and deteriorations occurred in developing and least developed nations.
To help multinational organisations be aware of political and economic risks worldwide, Marsh annually shares the independent analysis of BMI Research, a leader in providing multinationals, governments, and financial institutions with impartial forecasts, data, and analysis to guide critical strategic, tactical, and investment decisions. The updated Marsh Political Risk Map 2017 is based on BMI Research’s Country Risk Index (CRI), which assesses each country’s economic, political, and operational environment. Considering both short- and long-term risks to stability — economic and political — as well as operational risks to the business environment, the index provides cross-country comparisons on a global basis.
Under BMI Research’s method, the maximum CRI number for a country is 100 — the higher the index, the less political risk. More information about BMI Research can be found on their website. In the six months since the Political Risk Map 2017 was released, BMI Research assigned increases or decreases of greater than five points in 18 countries on its short-term political risk index (STPRI), a measure that takes into account a government’s ability to propose and implement policy, social stability, immediate threats to the Government’s ability to rule, the risks of a coup, and more.
Download the PDF to see the list of key increases and decreases, and the driving factors behind the changes.

